KKBox Real-time Customer Churn BI Dashboard
UEH Business Intelligence course project with streaming analytics and decision support
Built a near real-time Business Intelligence system for KKBox churn monitoring and retention decision support. The project combines Kafka log replay, Spark Structured Streaming, ClickHouse OLAP storage, FastAPI APIs, and a React dashboard to deliver descriptive, predictive-proxy, and prescriptive analysis in one workflow.
Timeline
2026
Type
Project
Status
completed
Outcome / Impact
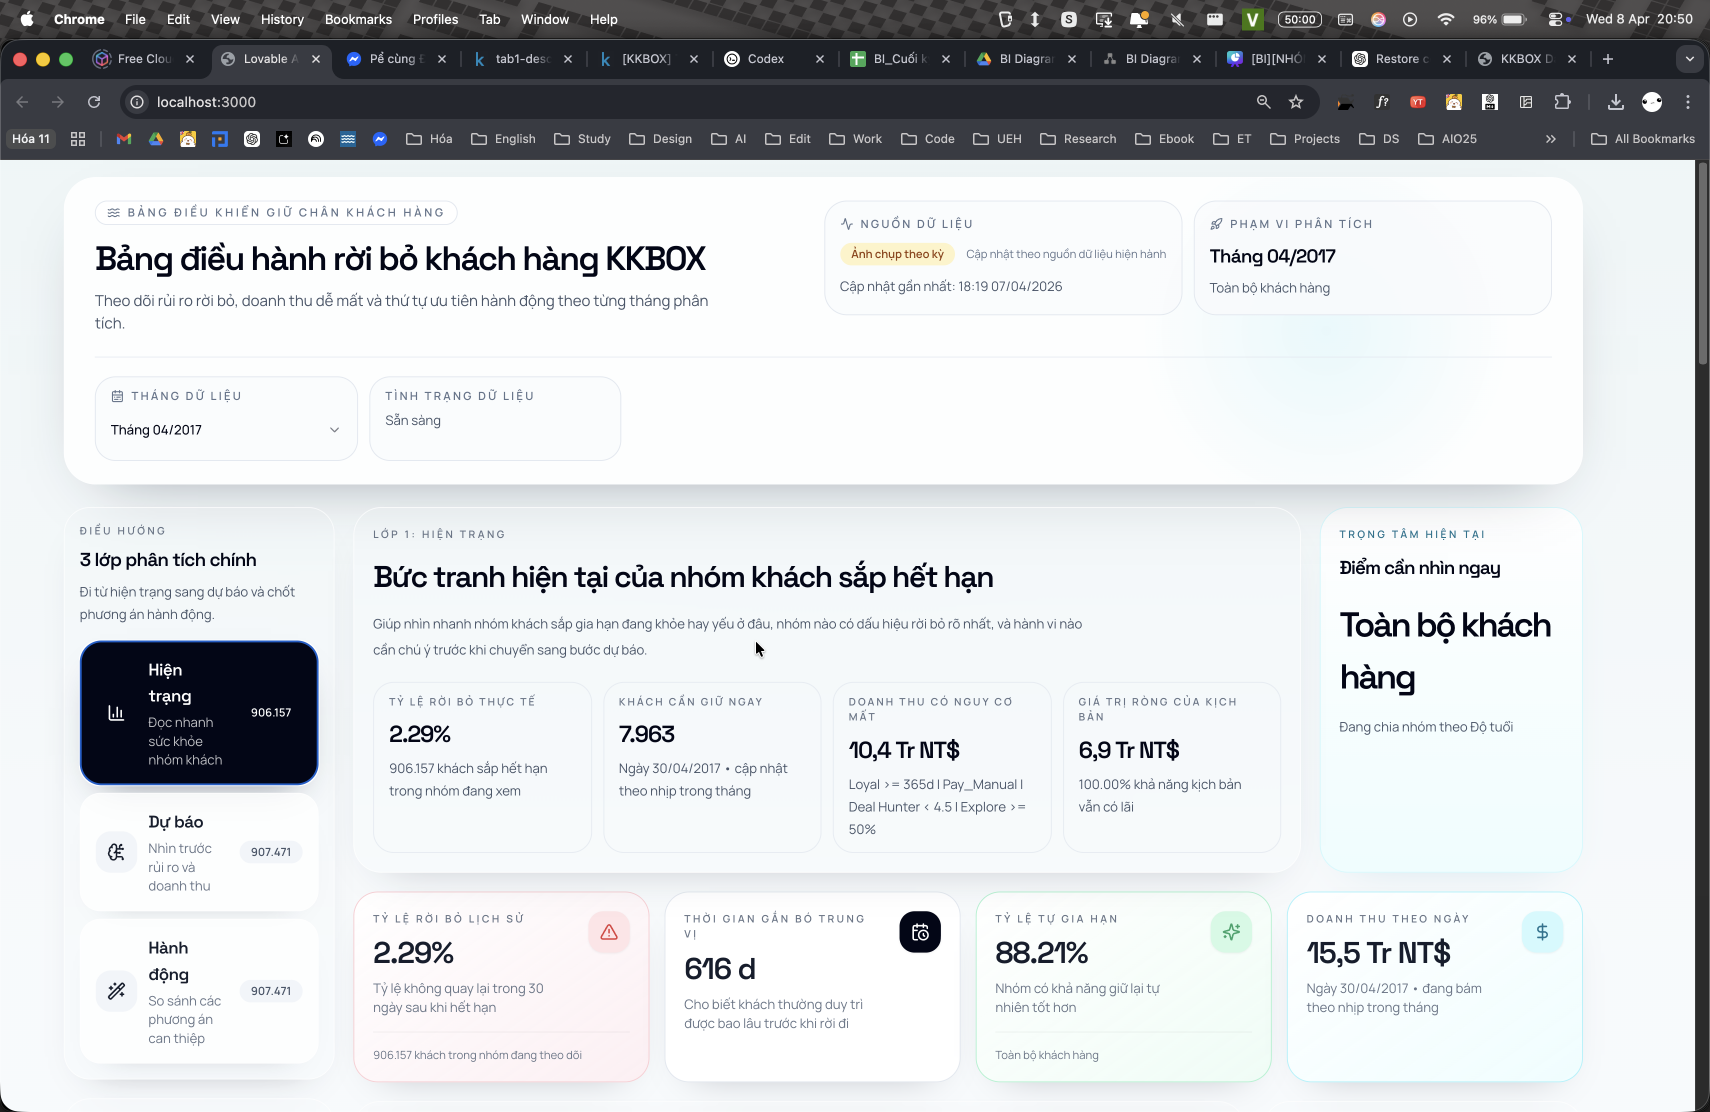
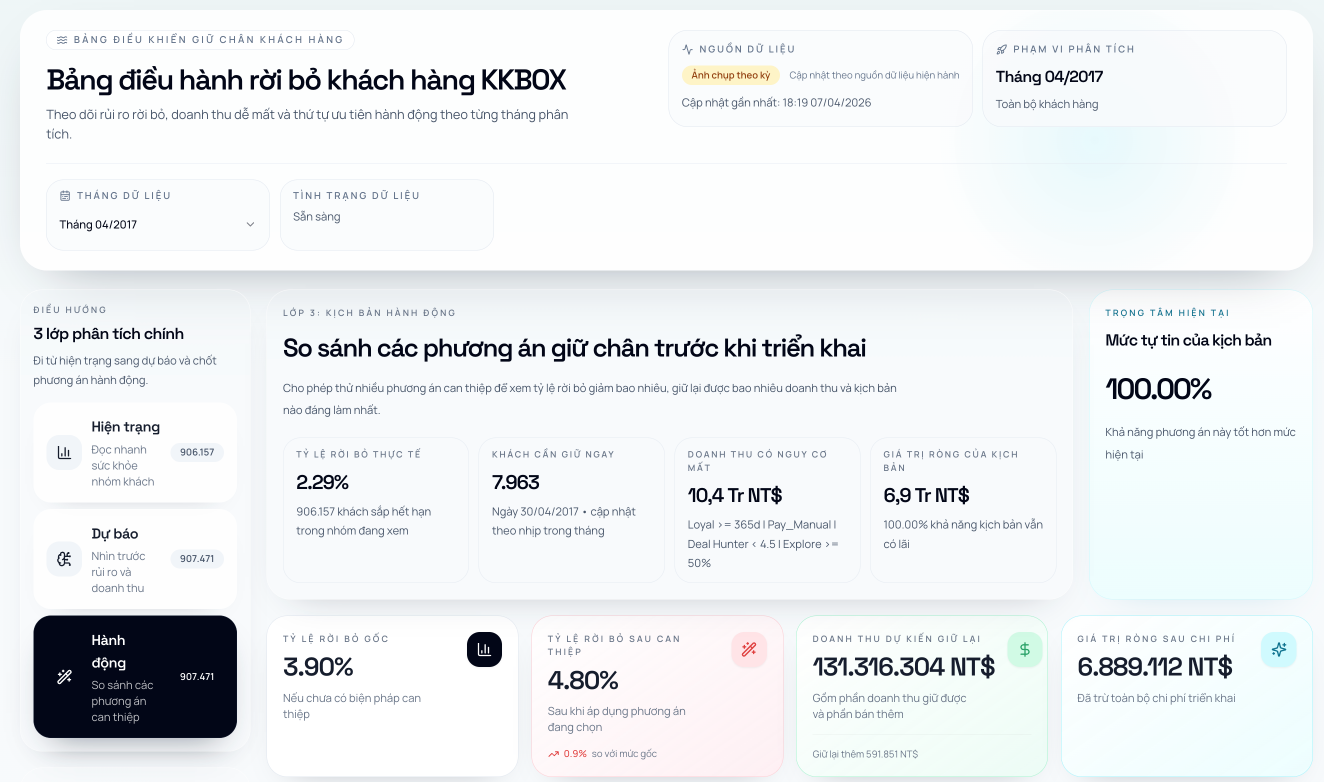
- •Delivered a 3-tab decision-support dashboard spanning descriptive analysis, predictive-proxy scoring, and prescriptive scenario simulation
- •Built end-to-end near real-time data flow: replay logs -> Kafka -> Spark Structured Streaming -> ClickHouse -> FastAPI -> React dashboard
- •Smoke-tested the artifact pipeline across 906,157-row descriptive snapshot, 887,123-row validation set, and 907,471-row scored test/simulation outputs
- •Deployed a live dashboard on Vercel and documented the stack for local/demo execution with Docker Compose
Tech / Skills
Project Media
Demo video and visual walkthrough for this project.
Project Screenshots
Case Study
1) Context / Problem
Subscription businesses need fast visibility into churn risk, revenue at risk, and which retention actions are worth funding. For the UEH BI course project, the objective was to move beyond static reporting and build a near real-time decision-support system that could ingest behavioral data, surface operational KPIs, and simulate retention strategies.
2) Your Role
As a core contributor, I worked on the feature-store-first BI workflow, dashboard productization, and the integration between the analytics pipeline and the serving layer. My work focused on turning batch and streaming artifacts into a usable business-facing dashboard across the three analysis tabs.
3) Approach
Designed the stack around replayed user logs and low-latency analytics: batch preload plus Kafka event replay feed Spark Structured Streaming, aggregated results land in ClickHouse, and FastAPI serves the dashboard to a React/Vite frontend. The product is organized into Tab 1 descriptive KPIs and survival analysis, Tab 2 predictive-proxy risk scoring, and Tab 3 prescriptive simulation with ROI-style scenario comparison.
4) Result / Impact
Delivered an end-to-end BI demo with working descriptive, predictive-proxy, and prescriptive views, plus a live dashboard deployment. The project successfully passed smoke tests over the canonical artifact chain, including 906,157-row descriptive snapshot data and 907,471-row scoring/simulation outputs.
5) Learnings
Near real-time BI depends as much on semantic consistency as on streaming infrastructure. Feature-store boundaries, serving-layer definitions, and honest model maturity labeling matter; predictive proxy metrics are useful for experimentation, but they should not be presented as fully productionized ML serving.
6) Links
See links above.